You are currently browsing the tag archive for the ‘technical analysis’ tag.
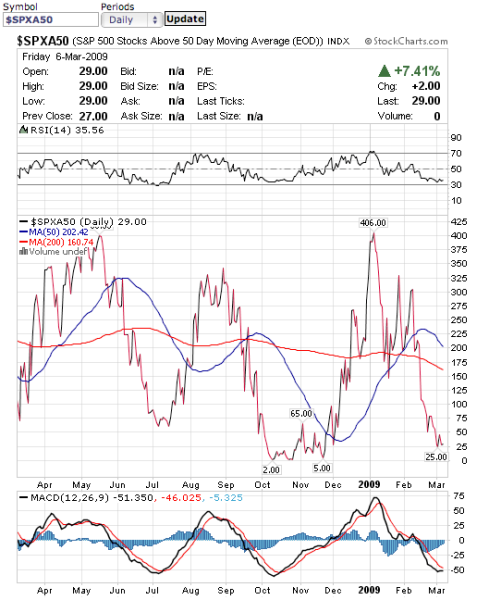
Its only a matter of time until people get tired of selling. This chart shows that only 29 stocks in the sp500 are above their 50 day moving average.
Also, notice how the MACD histogram is rising from negative to positive showing a decline in negative momentum. just an observation until we see actual bullish price action. the trend is still lower.
update on todays interesting action.
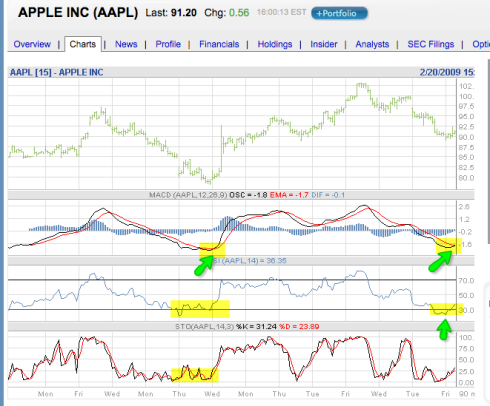
Bought some March calls to play. Technicals look to repeat the earlier rise shown on the chart. TARGET 102, RISK=lows of today.
XLF Daily Chart
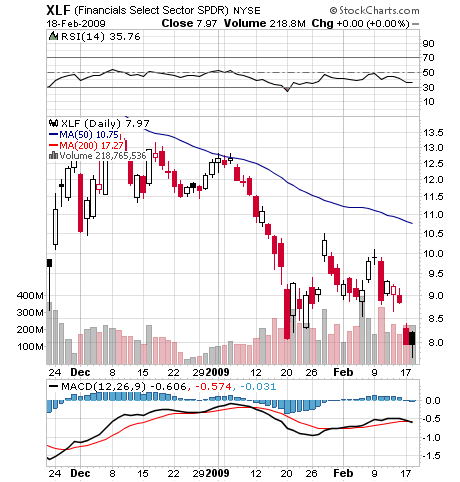
XLF may be full of banks that investors fear owning, the ETF may see a technical bounce of its support level. Buyers may find this level near 8 a low risk trade with an exit “clear and near”. With double bottom possibility, traders can buy here and set their stop losses just below the lows and know how much they need to risk before they are proven wrong if XLF makes even lower lows below current support. A more aggressive strategy would be to use call options but options may also reduce the amount of capital at risk.
Put to Call Ratio Chart
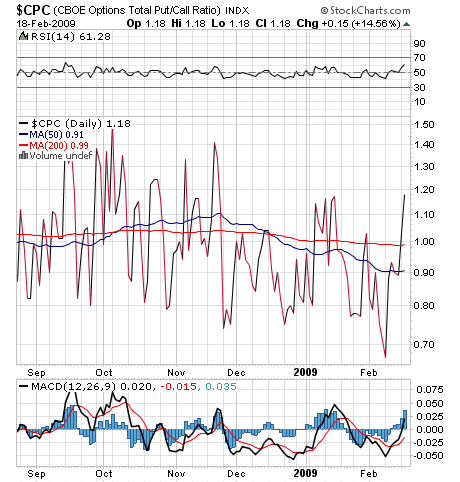
Put to call ratio show how many puts outweigh calls. This being options expiration week with 2 days to go, investors and traders can expect volatility either way.
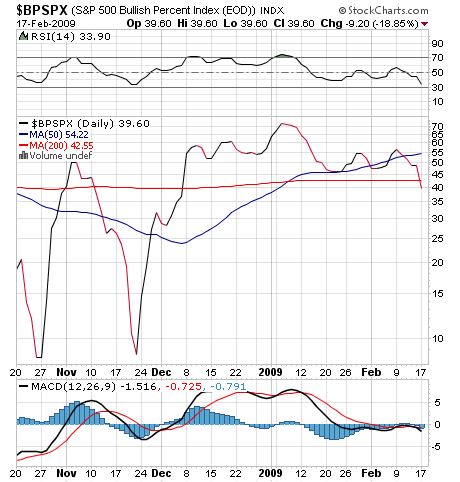
bulish percentage not so bullish BPI chart
BPI chart shows that even at these low levels the market may have been relatively crowded with bull betting on a up move on stimulus speculation. The momentum lower my squeeze many bulls as their stops get triggered. However, after a sell off like today, back testing and profit taking (for bears) is probable.
Monday night futures quotes are showing the dow may open lower on tuesday.
Next Level of supprt are the November lows.
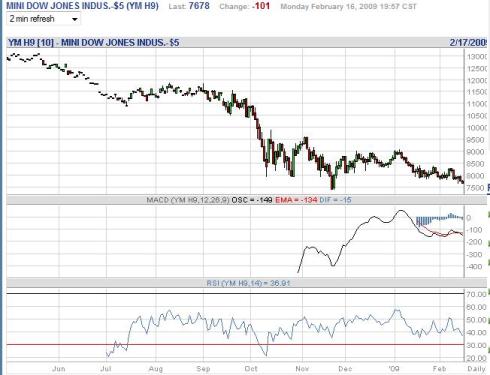
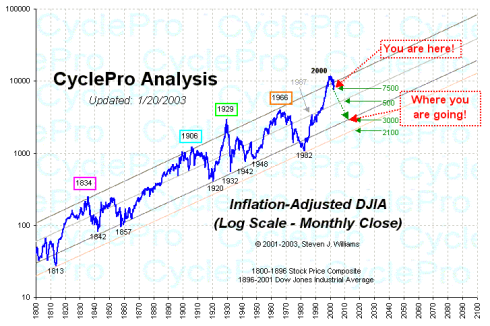
Use for reference of stock prices, not as a prediction…
<param name=”movie” value=”http://www.youtube.com/v/wqUhTqMWBog&hl=en&fs=1&color1=0

